One connected, cloud-based platform for crop research — UAV imagery, plot boundaries, vegetation indices, plot-level statistics and reporting in one place. No coding, no waiting.
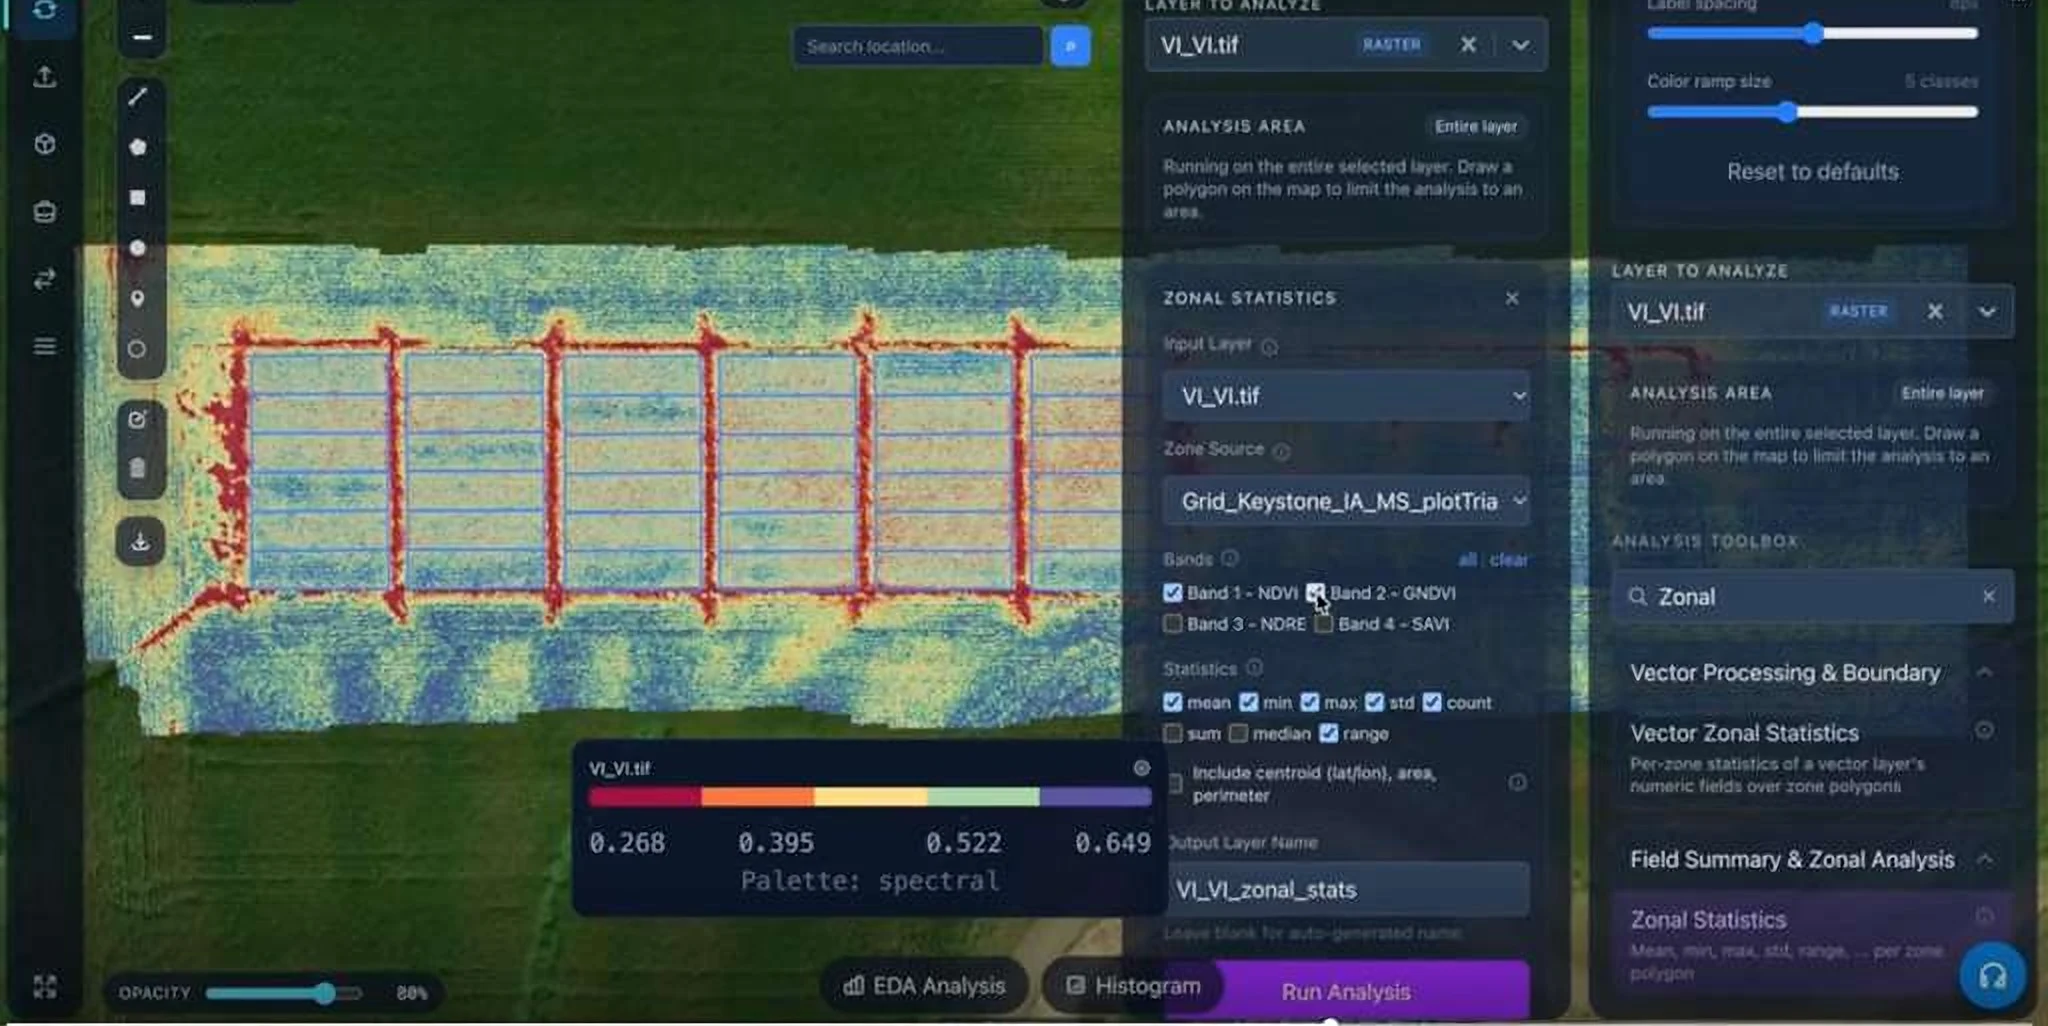
Crop research teams collect more plot data than ever — but it lives in separate tools. Every hand-off adds manual work, inconsistent methods and slower decisions.
 With Plotlytix: one web-based workspace, from data ingestion to reporting.
One system replaces disconnected GIS, spreadsheets, statistical tools, scripts and storage — less processing, more time interpreting.
Spatial, phenotypic, environmental and remote-sensing data in one workspace.
Workflow automation, geospatial analysis and breeding analytics — API-ready.
Dashboards, reporting and cloud collaboration for faster decisions.
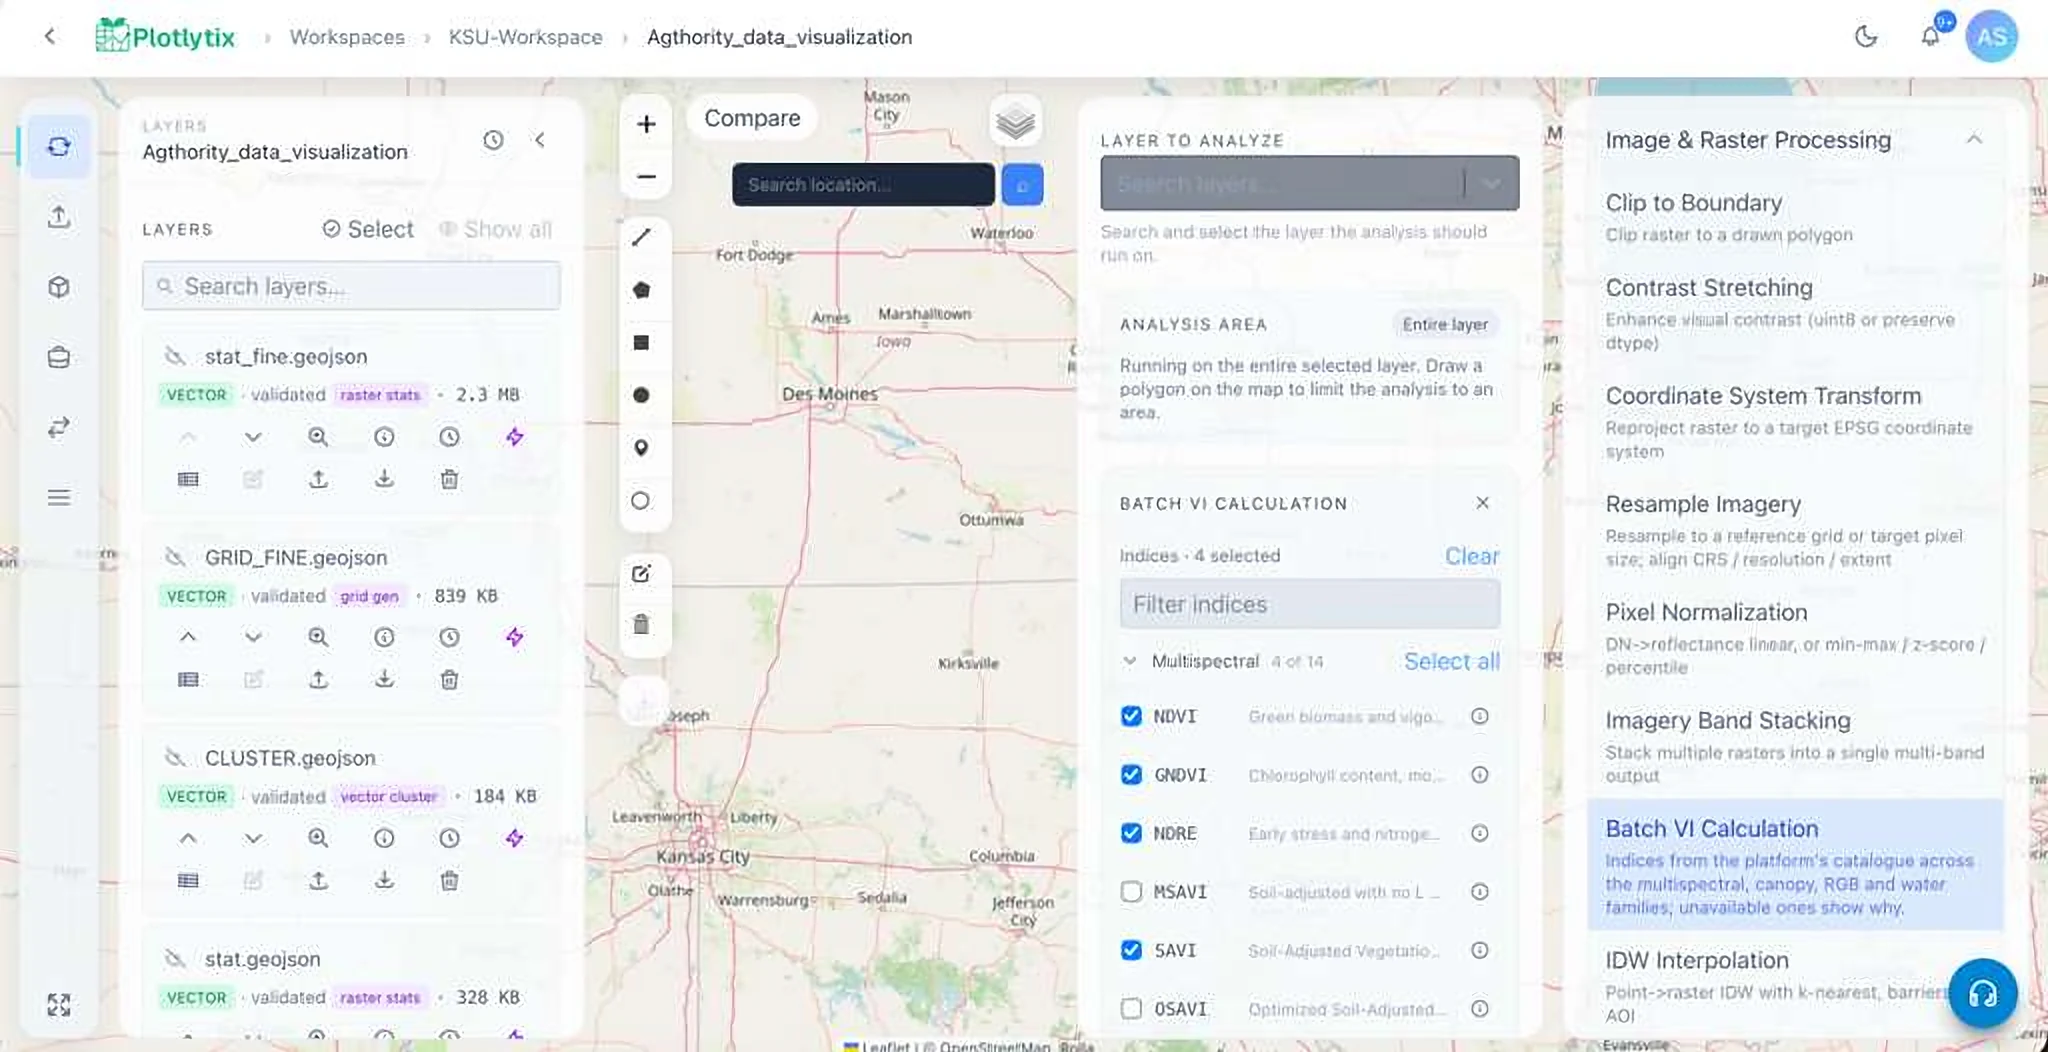
Generate plot grids over UAV imagery and calculate vegetation indices in a single batch.
Zonal statistics turn index maps into per-plot values that breeders can compare and export.
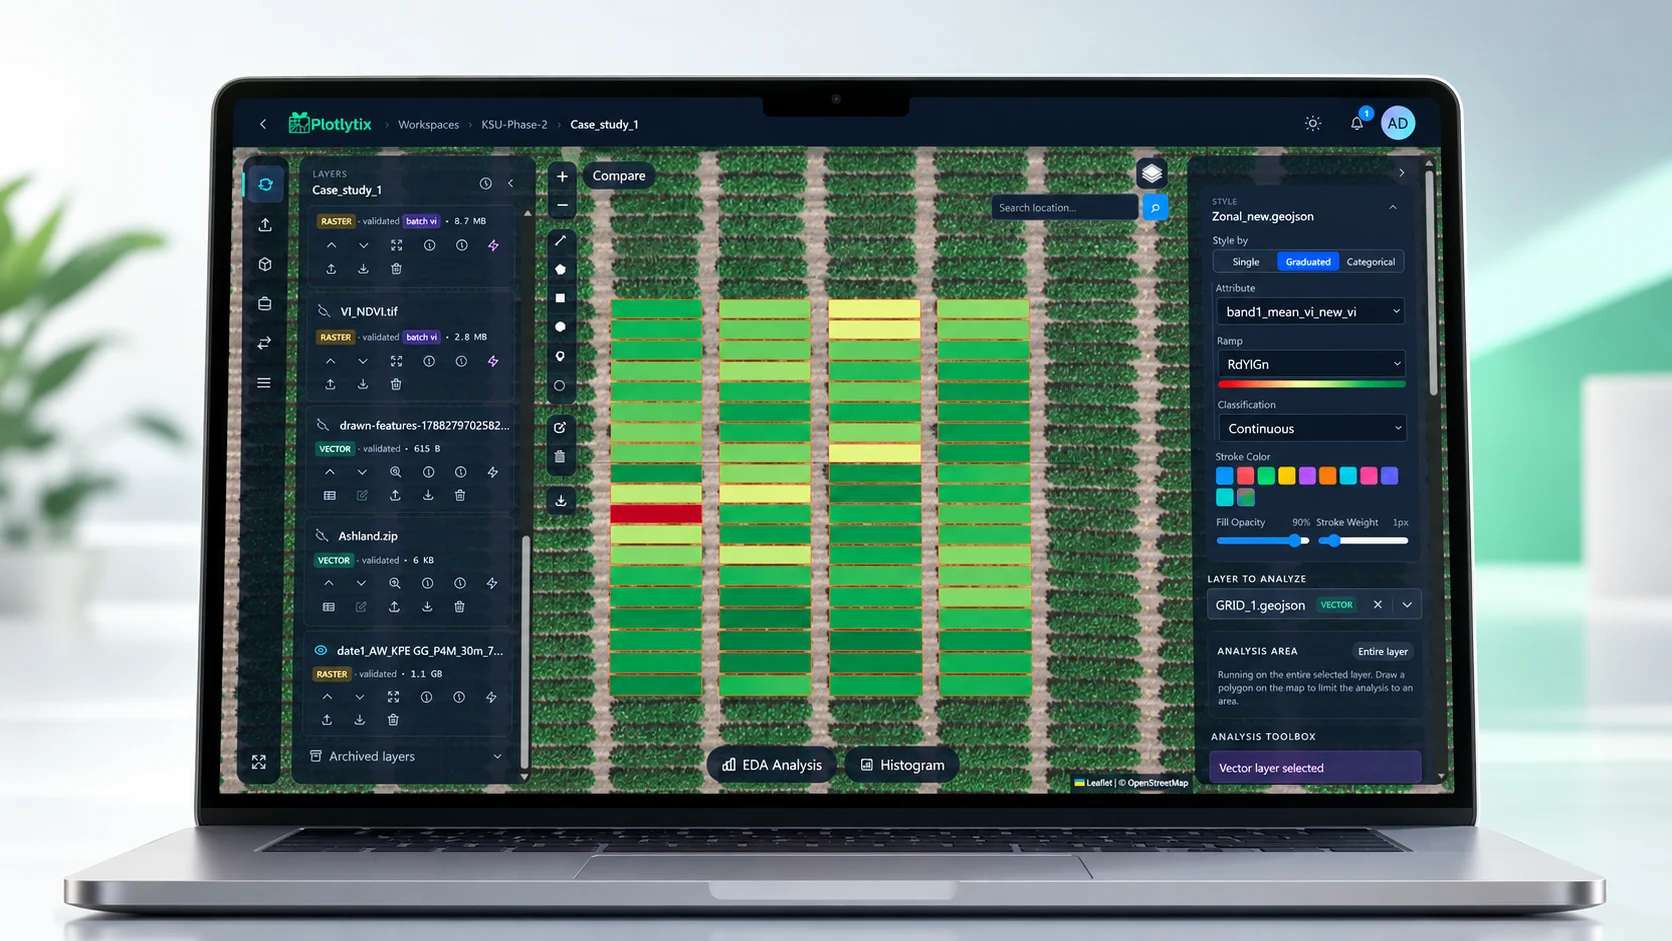
Results linked to their source layers.
Same steps across trials, sites and seasons.
Breeders run advanced analyses themselves.
GeoTIFF, GeoJSON, CSV in and out.
Coming next: saved workflows, multi-season history, version control, APIs and ML/AI capabilities.
Faster evaluation of lines, treatments and crop responses.
Timelier information for advancement decisions.
Less repetitive processing, more time interpreting.
Consistency and confidence across teams.
“Plotlytix has all the features and way beyond what we need for our workflows, and I was able to intuitively navigate without any formal training or walkthrough.”
“Plotlytix is one of the most powerful tools for our crop improvement experiments, and I see tremendous value in getting connected with our back-end systems through APIs.”
“Plotlytix is a much bigger analytical and insight platform, not just an analysis tool, and I see it fitting into our innovation farm research program.”
Breeding, phenotyping, GIS, remote sensing, ML, visualisation and statistics in one team — grounded in years of field-validated agricultural research.
Co-Founder · Professor and Director, ID3A
Co-Founder · Lead Developer
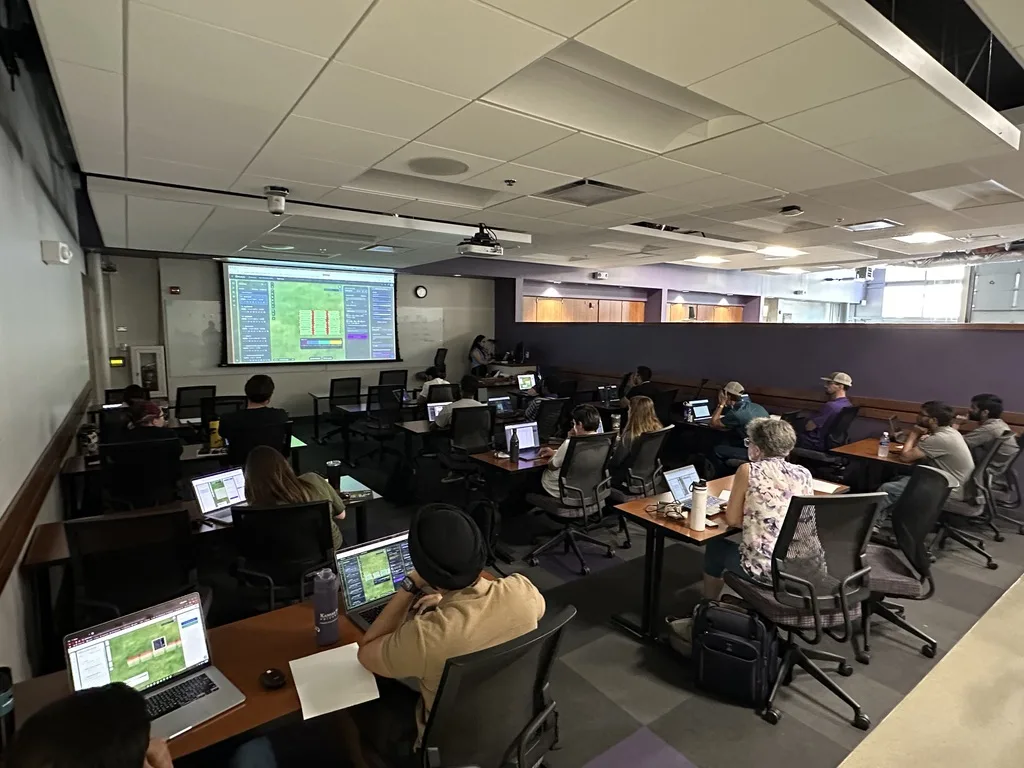
Let’s build the future of crop research — together. Request a demo on your own trial data.
✉ hello@plotlytix.com